

How to Read the Inverted Hammer Candlestick Pattern?
Candlestick charts are an invaluable source of information for any trader. Despite the overwhelming candlestick pattern variants, it is still crucial to understand its functions. Supposed you’re analyzing the momentum or the market trend with an inverted hammer candlestick, here’s how you properly read and to apply it strategically.
Generally, an inverted hammer is a type of candlestick pattern treated as a possible trend-reversal signal. As it is a well-known bullish reversal pattern, it mainly occurs at the end of a downtrend. The inverted hammer has a remarkable shape and clear-cut chart position make it recognizable among the others.
The inverted hammer is a variation of the regular hammer pattern. Typically, it’s easy to identify a hammer pattern though there are exceptions. Of course, there are instances where the inverted hammer is mistaken as a shooting star pattern. They look almost identical with a small real body and a long upper shadow, but it marks the possible lowering turning point. That is why traders must be aware of everything about the peculiarities of patterns.
How Does an Inverted Hammer Candlestick Look Like?

The inverted hammer consists of three parts: a body and two shadows (wicks). A real body is short and looks like a rectangle lying on the longer side. The upper wick is extended and must be at least twice longer than the real body. However, the lower wick is tiny or doesn’t exist at all. This pattern bears such a name because its shape has some resemblance to an upturned hammer.
How Does an Inverted Hammer Form?
The hammer occurs when open, low, and close prices are approximately the same. The inverted hammer is generated in the downtrend or after it, and this is a mark of a highly probable trend reversal. It appears when bullish traders are ready to change the trend after bearish traders have knocked the prices downwards. When looking into the upper wick, it shows the bulls’ attempts to push the price up as high as possible. In contrast, the lower wick is caused by the bears, who strive to stand against the higher price.
The hammer represents a one-day bullish reversal pattern. Its real body can either be bearish (the open is higher than the close) or bullish (the close is higher than the open). But it doesn’t matter how it looks like. In any case, it will be viewed at the bottom of a downtrend, and the market line is expected to reverse.
Trading With the Inverted Hammer
Any traders should be aware that no patterns can be utterly informative when being utilized or analyzed alone. Simple identification of the inverted hammer candle is not sufficient for successful trading, including (forex, stock, or even cryptocurrency).
There are other key factors, such as price action or the inverted hammer candle position, to consider when assessing a position. Supposed a trader is sure that he or she has identified the pattern correctly, it is necessary to start looking for other signals to confirm a possible reversal. However, this is a warning only but not a signal by itself to buy.

As the inverted hammer cannot be considered a decisive signal, it works well combined with some classic technical analysis patterns.
Double Bottom
On the contrary, Double Bottom is one of the most robust reversal patterns. Its shape resembles the letter “W” as it consists of two consecutive lowest points that are nearly equal, with a moderate peak between them.
The inverted hammer at the second bottom on this chart confirms the Double Bottom, and both indicators signal the market moves up. A trader needs to wait for the market closure above the inverted hammer’s high to go long.
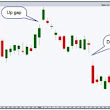
V-Bottom
This is another technical analysis pattern that receives its name after the letter. Its shape looks like the letter V and appears when price momentum changes from an aggressive selling to an aggressive buying condition.
The inverted hammer typically forms before a trader enters the trade. So when the market closes above the high of the inverted hammer, it’s time to go long. Keep in mind that it is necessary to trade these both patterns with a support level, as it tends to bounce off the trends.
Of course, there are also other ways to use the inverted hammer in trading. For instance, traders can make a profit from the pullbacks in an uptrend. In this case, the inverted hammer indicates a possible entry on a pullback.
The Trading Rules
This pattern can be introduced into a profitable day trading strategy if a trader considers some general considerations and scenarios. Since this is a bullish candlestick pattern, only the buying rules can be applied to it.
Reversal points. It is of crucial importance to identify the possible price reversal points on the chart. These can be support and resistance levels, rising trendlines, etc.
Time to enter the trade. It is tolerable to enter the trade after the confirmation candlestick formation. Such a strategy means there will be lower risks to enter a trade, but the purchase price will be higher, and the traders’ profits will be significantly lower.
Stop-loss. Traders set the stop-loss limits according to their trading views. But as a rule of thumb, they are 2-3 units lower than the inverted hammer candle’s low price. It is crucial to follow the stop-loss strictly as trading the candlestick patterns can never be considered failing.
Trading marks. Some important characters to be into consideration includes:
- The longer the upper wick is, the much more likely a reversal will happen.
- The candle’s color doesn’t matter though a white (green) candle is regarded as a more bullish sign than a black (red) candle.
- Pay attention to the body of the confirmation candlestick. The larger it is, the more serious the reversal uptrend trade signal is.
The Pros and Cons of an Inverted Hammer Candlestick
There is no ideal pattern that will work at any time in any situation. The inverted hammer is no exception. There are several obvious advantages of using this candlestick:
- It is not difficult to identify this pattern. It cuts a recognizable figure on a chart and cannot be confused with other patterns.
- The chance for reward is relatively high.
But these advantages are accompanied by disadvantages as well. The main disadvantage is common to all the strategies and scenarios. It may happen so that pattern will fail for no reason, even correctly identified.
The inverted hammer candle may be a signal of a short-time spike but not a longer-term trend. Also, sometimes the additional confirmation is desirable, and this results in loss of profits.
Inexperienced traders can confuse this pattern with its bearish variant, the shooting star mentioned above. They may miss the moment though the signal is evident.
Differences Between an Inverted Hammer and a Shooting Star

The form of these two candles is identical. A real short body is a combination of a long upper wick and a tiny lower wick (or no lower wick at all). Both can be regarded as a possible trend-reversal signal. But, the only distinction between them lies in the position they take in the chart.
The inverted hammer always appears as the final element of the downtrend. On the contrary, the shooting star appears at the top of the trend and marks the possible downward price movement. In a nutshell, these two patterns are similar in shape. However, they provide traders with different signals.
The Bottom Line
Candlestick charts are an integral part of technical analysis. The chance for success depends much on how a trader is familiar with candle patterns and uses them for trading no matter what asset they prefer. A candlestick can not be a trade signal in isolation. Instead, it’s best to get an accurate and precise holistic point of view when interpreting the candlestick.
The confluence of factors makes the basis for market development, but not a single factor, and this fact cannot be ignored. The ‘Reversal trend’ is not meant to be taken literally. If the inverted hammer has appeared on the chart, it doesn’t mean that the price line would undoubtedly change and go in the opposite direction. It means the change of the market sentiment, so the traders should be readу to look for other symptoms of the nearest moves. An inverted hammer candlestick can certainly be a useful tool for those who can use it in combination with other signals.